


They say a week is a long time in politics, but few weeks in US political history can ever have been as dramatic as the seven days from the assassination attempt on Donald Trump to Joe Biden withdrawing from the 2024 race.
Now that the dust has settled a little, how have these tumultuous events changed the polls and potentially the outcome of the election?
The Polls on 20th July
While it wasn’t conclusive, Trump had established a national lead of between 3% and 5% by mid-July. More damningly, that lead was consolidated in all the major battleground States which generally determine the results of US elections.
| State | Biden (%) | Trump (%) | Trump Lead |
| National | 44 | 47 | +3 |
| Wisconsin | 44 | 48 | +4 |
| Pennsylvania | 43 | 48 | +5 |
| Michigan | 43 | 48 | +5 |
| North Carolina | 42 | 48 | +6 |
| Arizona | 41 | 48 | +7 |
| Georgia | 41 | 48 | +7 |
| Nevada | 41 | 48 | +7 |
Based on average polls as reported in the New York Times
What the Latest Polls Say
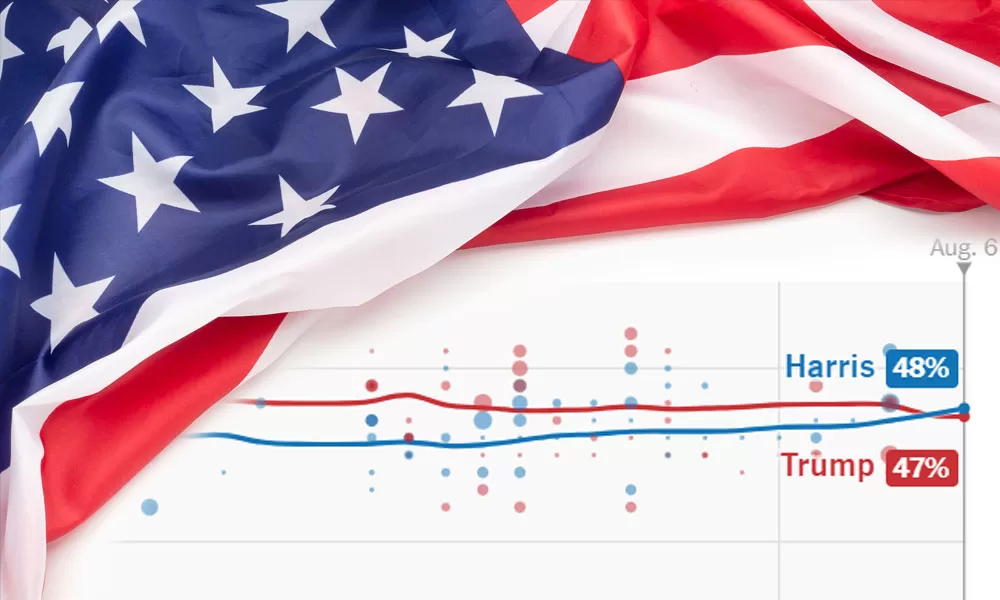
In the few weeks since Kamala Harris became the presumptive Democrat nominee, the polls now show a marked shift in her favor. Trump’s lead over Biden has been wiped out and the majority of polls show Harris marginally ahead.
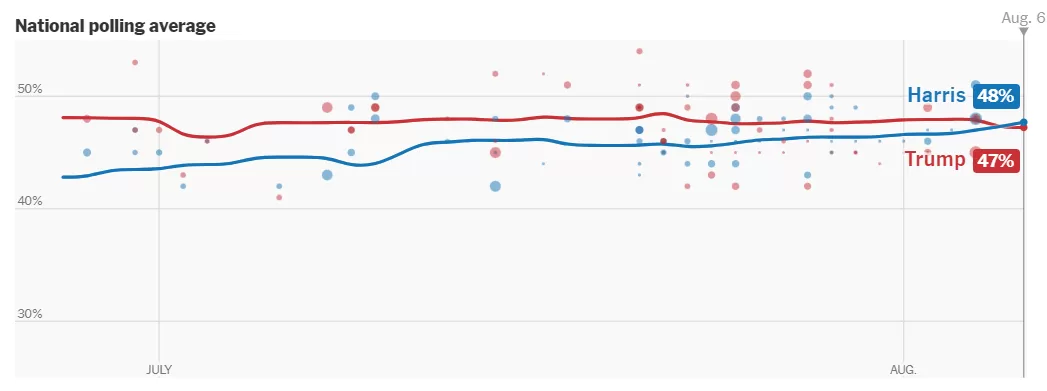
Source: New York Times
For example, a SurveyUSA poll shows Harris ahead with 48% to Trump’s 45%. Similarly, Morning Consult places Harris at 48% and Trump at 44%. A YouGov/CBS News poll reflects a tighter race, with Harris at 50% and Trump at 49%.
Battleground States Analysis
While national polls provide a broad overview, US elections always hinge on a few critical battleground states. Here’s a closer look at the polling data in key states:
- Georgia: Polling data from Public Policy Polling shows Harris leading by 1 point, while Trafalgar Group places Trump ahead by 2 points. The FiveThirtyEight average of polls has Trump leading by 1 point.
- Arizona: Public Policy Polling indicates Trump leads by 2 points, however a later poll for The Telegraph has Harris 1 point up. The FiveThirtyEight average has Trump just 1.5 up.
- Pennsylvania: Polls show a mixed picture, with Public Policy Polling indicating Trump leads by 1 point, while FiveThirtyEight’s polling average has Harris leading by 1 point.
- Michigan: Harris holds a small lead overall, with FiveThirtyEight showing her ahead by 1.5 points.
- Wisconsin: Harris leads by 1.5 points according to the FiveThirtyEight average.
- North Carolina: Trump leads, but his margin has decreased from 9 points in mid-July to 2 or 3 points by early August.
- Florida: While often a battleground State it was solidly for Trump by as much as 10 points in mid-July. The latest polls show a slight narrowing of Trump’s lead to 6 or 7 points.
Current Electoral College Standings
US Elections, of course, are not determined by the winner of the popular vote but by the Electoral College where votes are allocated based on the winner of each State.
If the battleground States go the way that current polling suggests then our prediction is that Kamala Harris will win the Presidency with 276 Electoral College votes versus 262 for Trump.
| State | Harris (%) | Trump (%) | Predicted Winner | Electoral Votes |
| Alabama | 35 | 60 | Trump | 9 |
| Alaska | 40 | 55 | Trump | 3 |
| Arizona | 45 | 47 | Trump | 11 |
| Arkansas | 35 | 60 | Trump | 6 |
| California | 60 | 35 | Harris | 54 |
| Colorado | 55 | 40 | Harris | 10 |
| Connecticut | 55 | 40 | Harris | 7 |
| Delaware | 54 | 41 | Harris | 3 |
| DC | no polls | no polls | Harris | 3 |
| Florida | 42 | 49 | Trump | 30 |
| Georgia | 44 | 48 | Trump | 16 |
| Hawaii | 60 | 35 | Harris | 4 |
| Idaho | 35 | 60 | Trump | 4 |
| Illinois | 55 | 40 | Harris | 19 |
| Indiana | 40 | 55 | Trump | 11 |
| Iowa | 42 | 53 | Trump | 6 |
| Kansas | 40 | 55 | Trump | 6 |
| Kentucky | 35 | 60 | Trump | 8 |
| Louisiana | 35 | 60 | Trump | 8 |
| Maine | 50 | 45 | Harris | 4 |
| Maryland | 60 | 35 | Harris | 10 |
| Massachusetts | 60 | 35 | Harris | 11 |
| Michigan | 47 | 45 | Harris | 15 |
| Minnesota | 50 | 45 | Harris | 10 |
| Mississippi | 35 | 60 | Trump | 6 |
| Missouri | 40 | 55 | Trump | 10 |
| Montana | 40 | 55 | Trump | 4 |
| Nebraska | 35 | 60 | Trump | 5 |
| Nevada | 46 | 45 | Harris | 6 |
| New Hampshire | 50 | 45 | Harris | 4 |
| New Jersey | 55 | 40 | Harris | 14 |
| New Mexico | 55 | 40 | Harris | 5 |
| New York | 60 | 35 | Harris | 28 |
| North Carolina | 45 | 47 | Trump | 16 |
| North Dakota | 35 | 60 | Trump | 3 |
| Ohio | 42 | 53 | Trump | 17 |
| Oklahoma | 35 | 60 | Trump | 7 |
| Oregon | 55 | 40 | Harris | 8 |
| Pennsylvania | 46 | 45 | Harris | 19 |
| Rhode Island | 55 | 40 | Harris | 4 |
| South Carolina | 40 | 55 | Trump | 9 |
| South Dakota | 35 | 60 | Trump | 3 |
| Tennessee | 40 | 55 | Trump | 11 |
| Texas | 44 | 50 | Trump | 40 |
| Utah | 40 | 55 | Trump | 6 |
| Vermont | 60 | 35 | Harris | 3 |
| Virginia | 50 | 45 | Harris | 13 |
| Washington | 55 | 40 | Harris | 12 |
| West Virginia | 35 | 60 | Trump | 4 |
| Wisconsin | 46.5 | 45 | Harris | 10 |
| Wyoming | 35 | 60 | Trump | 3 |
To demonstrate how on a knife-edge the election is, it would only take Pennsylvania’s 19 Electoral College votes – where Harris leads by 1 point according to recent polls – to switch to Trump for him to land a convincing 281 to 257 victory.
Factors Influencing Polling Accuracy
Several factors can impact the accuracy of polling data, leading to potential discrepancies between predicted outcomes and actual election results. It should also be remembered that a poll is only ever a snapshot in time, not a prediction of how voters will vote on election day. Poll accuracy can vary dramatically based on any number of factors.
Sampling Errors: Polls rely on samples of the population, and different samples can yield different results. This variability, known as sampling error, can cause fluctuations in poll results, making it difficult to distinguish between real changes in voter sentiment and random noise.
Systematic Biases: Polls may systematically underrepresent certain groups. For example, underestimating support for Trump voters was a significant issue in the 2016 and 2020 elections. Weighting adjustments based on demographic and political variables aim to mitigate these biases but can introduce errors if based on incorrect assumptions.
Response Rates: Declining response rates can lead to less representative samples. If certain demographic groups are less likely to respond to polls, their preferences may be underrepresented, leading to nonresponse bias.
Question Design: The way questions are framed can influence how respondents interpret and answer them. Subtle differences in wording and the order of questions can lead to significant variations in responses.
Timing of Polls: Voters who make their decisions late in the campaign can cause polling errors if their preferences are not captured in the final pre-election polls. Unexpected events or revelations late in the campaign can also shift voter sentiment.
How Pollsters’ Adjust for Improved Accuracy
Pollsters use several methods to account improve the accuracy of their polls.
Weighting Techniques: Pollsters adjust their samples to reflect the population’s demographics and geographic distribution. This includes demographic weighting (age, race, gender, education) and political weighting (past voting behavior, party identification).
Mixed-Mode Surveys: Using a mix of phone interviews, online surveys, and face-to-face interviews helps reach a broader and more representative sample, mitigating biases inherent in any single method.
Turnout Models: Pollsters develop models to predict voter turnout based on historical data, current political climate, and specific issues that may drive higher or lower turnout in different regions.
Real-Time Adjustments: Implementing follow-up surveys to reach nonresponders and adjust for any biases introduced by initial nonresponse. Continuously updating weighting schemes and sampling strategies based on new data and emerging trends.
Predictions
Given the complexity of getting accurate polling data, typical margins of error for the polls we looked at are around ±4 percentage points. In close races like those battleground States, this margin of error can significantly impact the predicted outcomes.
For instance, in Georgia, where Trump leads by 4 points, the margin of error suggests that Harris could actually be tied or even leading. Similarly, in Pennsylvania, where Harris leads by 1 point, the margin of error means Trump could be ahead, which as we have already seen, could hand Trump overall victory.
What we can predict with confidence is that this remains an incredibly close race. It is certainly a lot closer than it was in mid-July before President Biden withdrew. There is plenty of time left yet – if a week is an age in politics then the three months left until the election could see everything change multiple times yet.