The national picture
A handful of new flagship surveys released over the weekend tell broadly the same story. The only thing they disagree on is the scale of Labor’s lead, which could be anything from 4 per cent to 11 per cent.
- Newspoll (21–24 April) places Labor ahead 52–48 per cent after preferences. Primary votes are effectively level—34 per cent Labor, 35 per cent Coalition—while Peter Dutton’s net satisfaction falls to –24 and Anthony Albanese holds –9 with a sixteen-point advantage as preferred prime minister.
- YouGov’s weekly tracker (17–22 April) is marginally more favourable to Labor, giving them a lead of 53.5–46.5 per cent and—for the first time this term—shows Labor leading on the primary vote, 33.5 to 31. One Nation rises to 10.5 per cent, its strongest reading of the cycle.
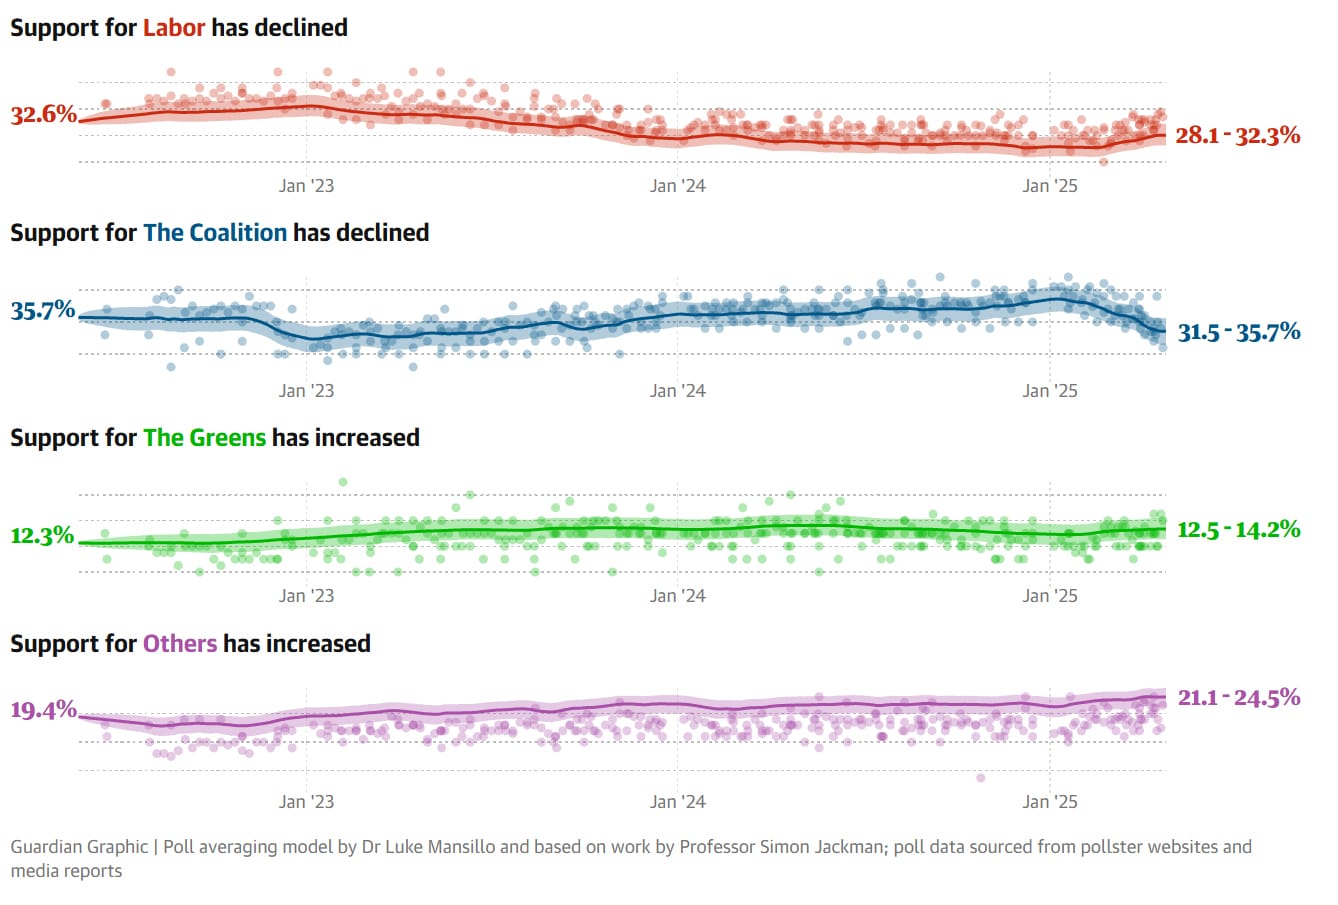
Meanwhile The Guardian’s poll tracker shows both parties essentially unchanged in two party preference with Labor on 49.5% – 53/2% and the Coalition on 46.9% – 50.5% – meaning all possible results are within the margin of error.

These latest polls – conducted before last night’s final debate – suggest Labor has consolidated its roughly four point lead on a two-party-preferred basis. This is narrower than at the same stage of the 2022 campaign, however it is accompanied by a Coalition primary vote approaching record lows.
Both major parties appear to be haemorrhaging support to the smaller parties, all of which have increased their share of the primary vote in recent weeks, according to The Guardian’s analysis:

What this vote share looks like in seats
National polls capture a snapshot in time of the electorate but the outcome of the election is, of course, determined on a seat by seat basis.
With 76 seats required for majority, a close race would point to a hung parliament in which Labor would be best placed to govern. Based on the latest polls Labor is projected to sneak a majority with 77 seats to the Coalition’s 57.
However, the projected ranges remain wide – Labor 62–88, Coalition 44–73 – so almost any outcome is still possible. While an outright majority for the Coalition looks unlikely, they could end up being the largest party in a hung parliament.
Redbridge’s latest marginal-seat tracker (conducted 15 – 22 April) suggests Labor is stretching its advantage where it matters most. Across the top 20 marginal electorates from 2022 (where Labor held an average lead 51–49 to Labor in 2022), the poll suggests Labor now has a 54.5–45.5 two-party lead – a swing of 3.5 points since the last election and fully 6.5 points since the tracker began in February. Translating that shift to the national map would push the countrywide margin out to roughly 55.5–44.5, a result big enough deliver Labor a comfortable majority.
Early voting and what it reveals
A record 542,143 votes were cast on the first day of early voting on 22nd April, up from 314,496 on the corresponding day in 2022. By Saturday evening, the Australian Electoral Commission had issued well over 2.5 million ballot papers, indicating that more than half of all electors are likely to vote before polling day.
Several pollsters conduct exit surveys of early voters. One such exercise – RedBridge/Accent for News Corp – interviewed 4 000 voters across nineteen marginal seats in the first 48 hours of early voting.
The margins of error at seat level are steep (approximately ±7 points), yet the aggregate suggests Labor’s primary vote has improved in most Labor–Coalition contests and the two-party swing in those divisions is running at around three to four points to Labor.
The poll also underlines a perennial feature of Australian early voting: those who turn out in the first week are disproportionately older homeowners and shift-workers—demographics that lean to the Coalition—while younger, renting and Green-aligned voters tend to appear later.
Why the polls could still be wrong – the complexities of polling in Australian elections
In 2019 all the polls across all methodologies – live phone polls, IVR robo-calls and online panels – pointed firmly to a Bill Shorten victory for Labor. Of course the Coalition ended up overturning expectations on the day to win a handsome victory.
The review of polling methods conducted by AMSRO found that “Every national poll published in the campaign over-estimated Labor’s two-party vote by about three percentage points.” It further found that samples were “stuffed with university-educated, politically engaged respondents” and that standard weighting for age, gender and region did not counterbalance this.
As a result, from 2022 onwards, education weighting is now universal, and some pollsters attempt to model political engagement. However, the structural imbalance remains. Graduates are still the respondents most likely to pick up the phone or click through to take part in online surveys.
The mode debate
The need to have representative samples leads pollsters to utilise different methodologies to reach different groups of people, and then combine the results. Each of the main polling methods – online, live phone interviewing, and IVR – have their advantages and limitations:
| Mode | Principal advantages | Principal limitations |
| Online panels (CAWI) | Very rapid, inexpensive, strong reach among digitally engaged under-40s | Opt-in participation; under-samples rural, low-income and senior voters |
| Live CATI | Superior coverage of regional and older cohorts; interviewers clarify ambiguous responses | Pick-up rates below 10 per cent; costs at least five times an online interview |
| IVR robo-polls | Extremely low marginal cost per call; vast scale overnight | Hang-up rates above 90 per cent; no scope for clarification |
Most organisations now run blended designs—typically two-thirds online and one-third phone—yet it is not uncommon for a CATI-heavy study and an online-only panel can give vastly different results.
For example, take these two panels. An ABC Vote Compass (online, self-selecting) survey reported 25 per cent of 145,000 participants placing cost of living as their single greatest concern. Meanwhile, a Roy Morgan (phone + online) conducted before the election found 57 per cent of 2 850 respondents listing it in their top three.
Question wording can always explain part of the divergence between two polls. Methodology and the make-up of the sample explains the rest. Vote Compass is dominated by younger, digitally fluent users, whereas telephone samples tend to lean towards more older and suburban voters.
Other polling complications in Australia
Compulsory voting
While turnout modelling bedevils pollsters in voluntary systems, Australia’s compulsory voting system introduces a different challenge. The small but electorally significant cohort that ignores surveys, yet still appears on polling day, proved decisive in 2019 when they broke late and disproportionately toward the Coalition. The AMSRS review suggests their absence added “at least a point and possibly more” to the final polling error.
Modelling preference flows
Newspoll continues to apply 2022 preference distributions (for example, 80 per cent of Greens voters to Labor). YouGov and Resolve ask each respondent where their next preference would go. Either method can fail if behaviour shifts. For example, One Nation preferences flowed 65-35 to the Coalition in 2019, but only 55-45 in 2022. Teal independents split virtually 50-50. Given that minor-party primary votes hover near 18 per cent, and that share is increasing, a single-point mis-estimate in their flows can move the national 2PP by two points.
The promise and the limits of MRP
Multilevel regression with post-stratification, was pioneered after 2019 by YouGov to more accurately predict the winners of each seat. The method divides the electorate into tens of thousands of demographic “tiles” then re-aggregates them into divisions. While it is a great improvement and worked well in 2022, its accuracy is capped by the quality of the underlying data. Census cross-tabulations for remote Western Australia or the Northern Territory are sparse, for example. YouGov’s own technical note attaches a ± five-seat band to its central forecast.
New entrants, no precedent
Legalise Cannabis, an enlarged Animal Justice Party and an expanding cohort of community independents inject enthusiasm into elections at seat level, but also uncertainty. With no historical preference data, pollsters rely on minimal micro-samples and informed guesswork. In marginal seats decided by four-figure margins that guesswork can be the difference between predicting a result correctly, or not.
Early voting compresses the timetable
With the AEC already recording 2.5 million pre-poll votes – and anticipating a majority of ballots cast before polling day – any trends of events that precipitate a late swing can influence only that shrinking share of the electorate who have not yet voted.
Why live telephone polling still matters
Geography and demographics, particularly in Australia, compound every other difficulty, making seat-by-seat predictions extremely difficult to make. Many Australian seats are remote, extremely large, and made up of areas with vastly different demographics.
Using a mix of all modes enables a pollster to reach as many of those different demographic groups as possible. Live phone polling can play an essential role here in ensuring that quotas for different geographical areas and demographic groups are met.
Using either roll-based lists or postcode-stratified random-digit dialling, supervisors can instruct interviewers (or, more likely, the dialler) to continue dialling a given group until they have completed eighty interviews with people in that group.
Replicating that precision with an opt-in online panel alone is almost impossible. Invitations can be issued and screening questions applied, yet the pollster cannot compel a sufficient number of 25-to-34-year-old shearers in Parkes or mechanics in Durack to volunteer in any given week.
Regardless of response rate – even if fewer than one call in ten ends in a full interview – a well-organised CATI facility can still produce the 100–120 completes per seat that sophisticated models require. Interviewers can vary call times, recycle unanswered numbers and call mobile-only households until quotas close. When the sample for a rural seat dries up online, the quota remains empty.
For more information, download our White Paper here.
Are we any wiser?
We are—though only incrementally. Education weighting, multimode sampling and the transparency standards set by the Australian Polling Council have eliminated many of the structural and sampling errors revealed in 2019.
However, preference-flow volatility, regional under-coverage, declining response rates, and record early voting all mean that Labor’s four-point lead sits within the margin of error.
With perhaps twenty seats genuinely in play, and the independent vote share at its highest in living memory, a final week shift – or an unforeseen preference flow quirk – could yet swing the outcome.


